Imagine you are evaluating the effect of a job training program across genders. In both men and women separately, the program seems to help; but when you pool the data, the effect vanishes or reverses. That’s not just annoying, it can completely mislead your inference if you don’t look out for lurking variables. Welcome to the simpson’s paradox, a really weird and frustrating statistical phenomenon.
At first glance, Simpson’s paradox seems impossible. How can combining two datasets that both show a positive effect suddenly yield a negative overall effect? Yet this reversal is not only possible, but surprisingly common in applied research. Simpson's paradox appears often when dealing with very differing group sizes or confounding variables.
A Simple Example
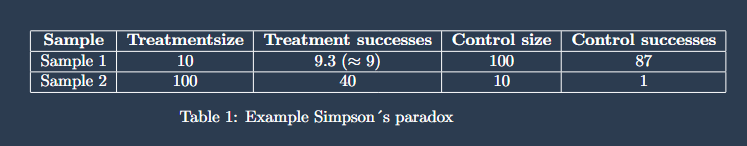
Consider 2 samples: for sample 1, the treatment success rate is 93% and the control success rate is 87%. For sample 2 the treatment success rate is 40% and the control success rate is 10%. It seems obvious that the treatment success rate must be higher than the control success rate. But when you combine the groups, the result reverses. Looking at the table below it is clear to see that this is caused by the group sizes being completely different.
Confounding Variables
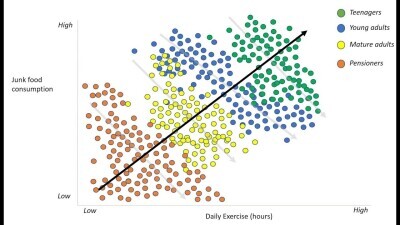
Group size is not the only cause for simpson's paradox. Lets consider the correlation between hours of exercise per week and junk food consumption. If we look at different age groups such as teenagers or mature adults, we see that the less daily exercise someone performs, the more junk food they consume. This seems very logical as the people who exercise more tend to enjoy a more healthy lifestyle and thus consume less junkfood. But when we aggregate over all age groups, the result flips, showing that more exercise is related to eating more junk food. This happens because age groups like teenagers are the most active group but also consume the most junk food. Age acts as a confounding variable in this case. The image below perfectly illustrates the simpson's paradox:
Simpson's viewpoint?
Mathematician Jordan Ellenberg argues that simpson's paradox is misnamed, and that it is not actually a paradox. He states that in reality it is just different ways of looking at the same data. The lesson to be learned is not that either viewpoint is better, but to look at subgroups and aggregates seperately, and potentially be able to draw multiple empirical conclusions from a single dataset.
Avoiding simpson's paradox
Simpson's paradox leaves room for multiple correct empirical conclusions according to Jordan Ellenberg, but if you are not careful it can lead to wrong or incomplete conclusions, and even contradictions. There are three things to keep in mind when doing empirical research regarding simpson's paradox:
- Check subgroup trends to see if aggregate and subgroup results match
- Control for confounding variables: include covariates that may influence both treatment and outcomes
- Beware of aggregation: combining data across heterogeneous groups may cause distortions
Moral of the Story
Simpson’s paradox serves as a powerful reminder that statistical analysis is not just about crunching numbers, but also about understanding the data-generating process. Aggregating without considering context can turn valid subgroup relationships into misleading overall conclusions. So next time your regression results change unexpectedly, take a closer look. You might just be witnessing Simpson’s paradox in action.